
Reports & Analytics Overview
TimelyChurch provides a comprehensive reporting module that gives you real-time insights into your church's health and growth. From the Reports dashboard, you can track people, attendance, schedules, small groups, volunteers, events, forms, and follow-ups -- all in one place.
Accessing Reports
- From the admin sidebar, click Reports to expand the section.
- Choose All Reports to open the main Reports & Analytics dashboard (quick reports, overview metrics, charts, and links to every report), or Church Health to open the Church Health dashboard.
Plan requirement: Reports & Analytics is a Pro plan feature. If your church is on the Starter or Growth plan, the Reports section appears locked with an upgrade prompt. Upgrade to Pro to unlock it.
Who Can Open Which Report
Access to Reports is controlled by the Reports row on your role (in Administration > Roles & Permissions). The Reports row has two actions: View opens report pages, and Export shows the Export CSV buttons. Administrators have both by default.
Reports that list individual people -- their names, contact details, birthdays, absences, or pastoral follow-ups -- are personal data, so they also need access to the matching area of TimelyChurch. Links to reports you can't open are hidden from the dashboard, and the same rules apply to their CSV exports.
| Report | Needs, in addition to Reports |
|---|---|
| People Overview (page) | -- |
| People Overview (Export CSV) | People |
| New People, Missing, Birthdays, Visitors | People |
| Attendance Overview, Attendance by Class | -- |
| Absentees | People |
| Check-ins | Check-in (View) |
| Check-in Analytics | -- |
| Schedules: Overview, Coverage Gaps, Teacher Activity | -- |
| Small Groups | -- |
| Volunteers | People |
| Follow-ups | People and Follow-ups |
| Events, Forms | -- |
| Church Health dashboard | -- (the Total Giving tile also needs Giving access) |
Every Export CSV button additionally needs the Export action on the Reports row.
Team leaders see their own teams. If someone's role reaches only Their teams (for example the built-in Team Leader role), reports that list people -- the People, Attendance, Check-in, Absentee, Volunteer, and Follow-up reports -- show only the people connected to the groups, classes, and serving teams they lead. See Team reach.
Reports Dashboard
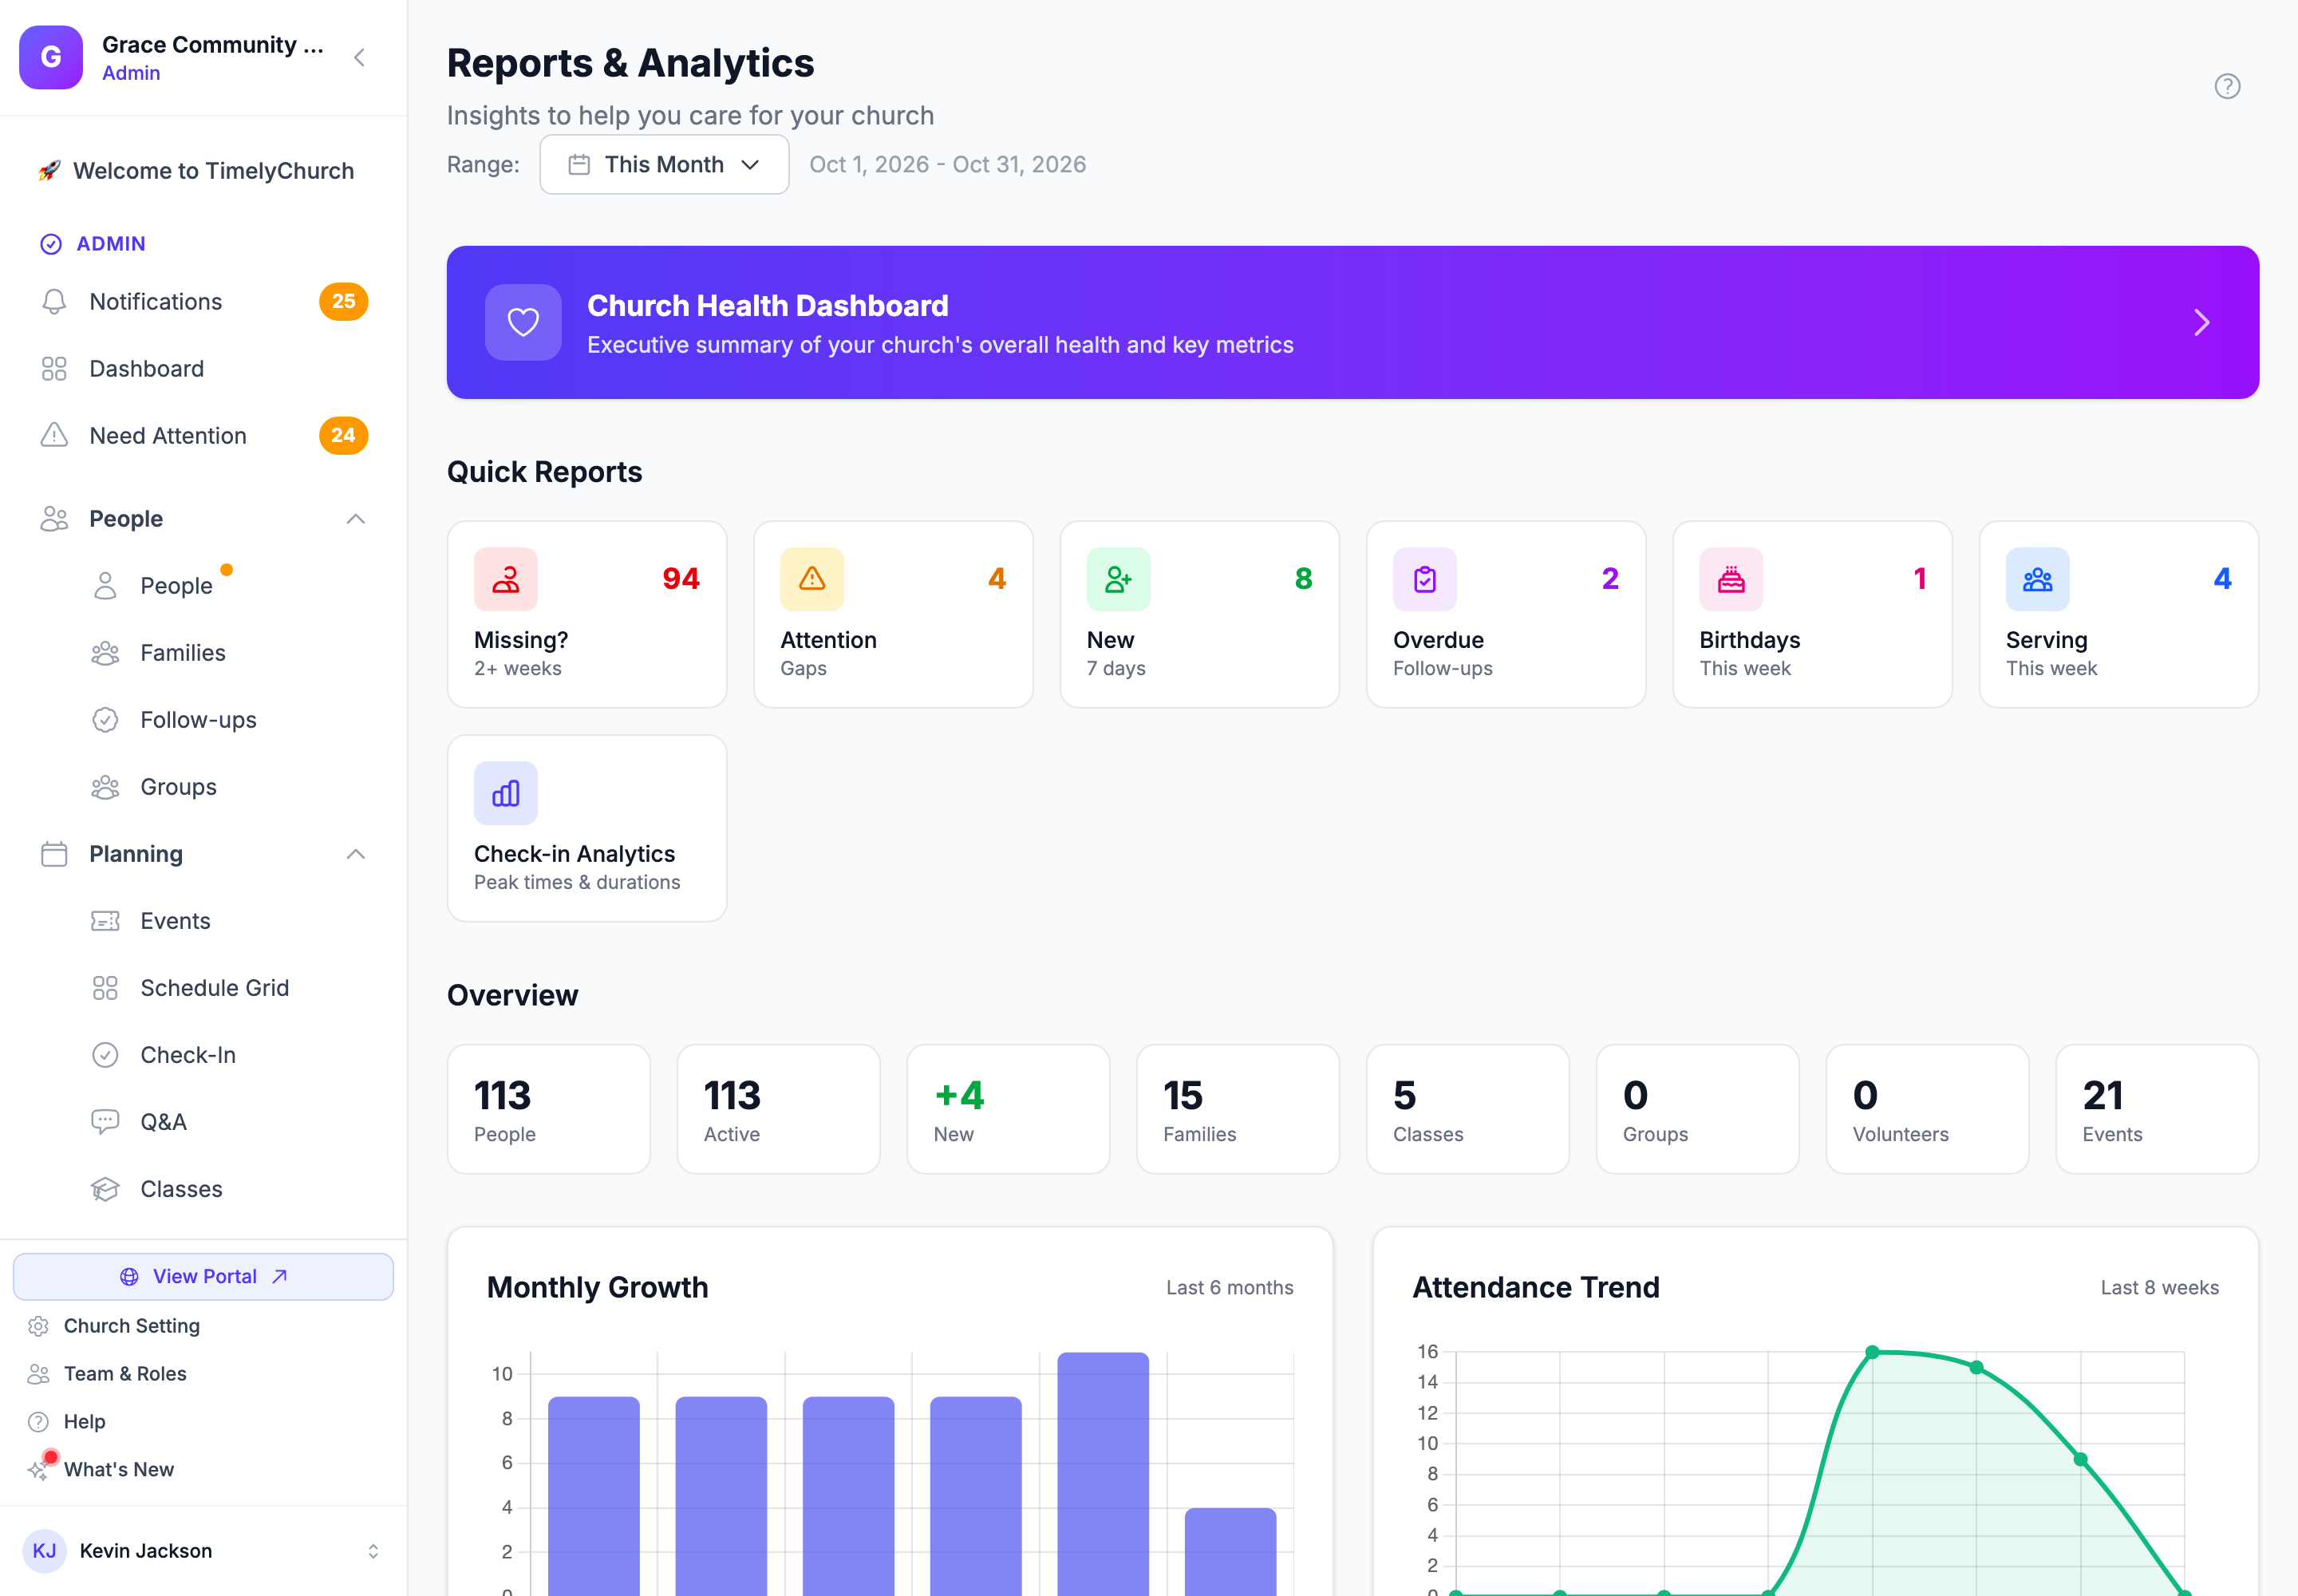
The main dashboard is divided into several sections designed to surface the most actionable information first. At the top, a Church Health Dashboard banner opens the executive summary (see Health Dashboard).
Quick Reports
Below the banner, quick-report tiles give you an at-a-glance summary of items that may need your attention. A red number means something is waiting.
| Tile | What it counts | Opens |
|---|---|---|
| Missing? (2+ weeks) | Active people who have not attended in 2 or more weeks | Missing report |
| Attention (Gaps) | Upcoming schedule gaps -- missing teacher, missing lesson, or needs a substitute | Coverage Gaps |
| New (7 days) | People added in the last 7 days | New People |
| Overdue (Follow-ups) | Pending follow-ups past their due date | Follow-up Reports |
| Birthdays (This week) | People with a birthday this week | Birthdays |
| Serving (This week) | Teachers scheduled to serve this week | Schedule Overview |
| Check-in Analytics (Peak times & durations) | -- | Check-in Analytics |
Tiles for reports you can't open (see the table above) are not shown.
Overview Metrics
Eight summary cards display your church's key numbers for the selected date range: People, Active, New (people added in the selected period), Families, Classes, Groups, Volunteers, and Events.
Charts
The dashboard includes two interactive charts:
- Monthly Growth -- A bar chart showing new people added each month over the last 6 months, with the total and average per month.
- Attendance Trend -- A line chart displaying weekly attendance over the last 8 weeks, with the total and average per week.
All Reports
The All Reports section links to every report page, in four groups:
| Group | Reports |
|---|---|
| People | Overview, New People, Missing, Birthdays, Visitors |
| Attendance | Overview, By Class, Absentees, Check-ins, Check-in Analytics |
| Schedules | Overview, Gaps, Teachers |
| More | Groups, Volunteers, Follow-ups, Events, Forms |
Each report has its own page with summary statistics, visual breakdowns, and detailed data tables.
Membership Breakdown
A color-coded breakdown of active members by membership status (Visitors, Regular, Members, Inactive, Former) is displayed at the bottom of the dashboard.
Date Range Selector
Most reports include a date range selector (Range:) that lets you control the time period for the data shown. The following preset ranges are available:
- Today
- This Week
- Last 7 Days
- This Month (default on most reports)
- Last 30 Days
- Last 90 Days
- This Year
- Last Year
- Custom range… -- choose a From and To date, then click Apply
Click the date range button in the upper-right area of any report page to switch between presets. The currently selected dates are displayed alongside the selector.
Exporting Data
Most report pages include an Export CSV button. Click it to download the report data as a CSV file. For more details, see Exporting Data.
Financial and Giving Reports
Financial and giving reports are not part of the Reports module -- they live in the Finances section of the sidebar and follow the Giving and Accounting permissions.
- Giving reports -- the Giving page summary cards, donor exports, receipts, and statements. See Giving Reports and Analytics.
- Financial reports -- open Finances > Accounting and click the Reports tab (the Financial Reports hub): Treasurer's Report, Income Statement, Balance Sheet, Trial Balance, General Ledger, Budget vs Actual, and Giving Statements. The 1099 Report is in the accounting Setup ▾ / More ▾ menu. See Financial Reports.